The Data You Need to Forecast, Schedule, and Optimize
Workforce planning starts with accurate data. HiveDesk captures every agent hour, tracks adherence against schedules, measures shrinkage, and exports it all — giving you the historical foundation to build better forecasts and staffing models.
No credit card required · $5/user/month · All features included
Forecasting Without Clean Data Is Just Guessing
Your staffing models are only as good as your input data. If hours, adherence, and shrinkage numbers are inaccurate or incomplete, every forecast you build is compromised.
What workforce analysts struggle with
- Hours data comes from manual timesheets that are inaccurate or submitted late
- Schedule adherence is not tracked — you cannot measure what you cannot see
- Shrinkage is estimated or assumed rather than measured from actual data
- Overtime patterns are discovered after the fact, not analyzed proactively
- Historical data is scattered across spreadsheets with no single source of truth
- Exporting usable data from existing tools requires manual cleanup
How HiveDesk solves it
- Actual hours tracked automatically — no manual timesheets to clean up
- Adherence reports compare clock-in/out against scheduled shifts automatically
- Shrinkage measured from actual productive time vs scheduled hours
- Overtime data available in real time for proactive analysis
- All workforce data in one system — hours, adherence, attendance, activity
- Export any report as Excel — clean data ready for your models
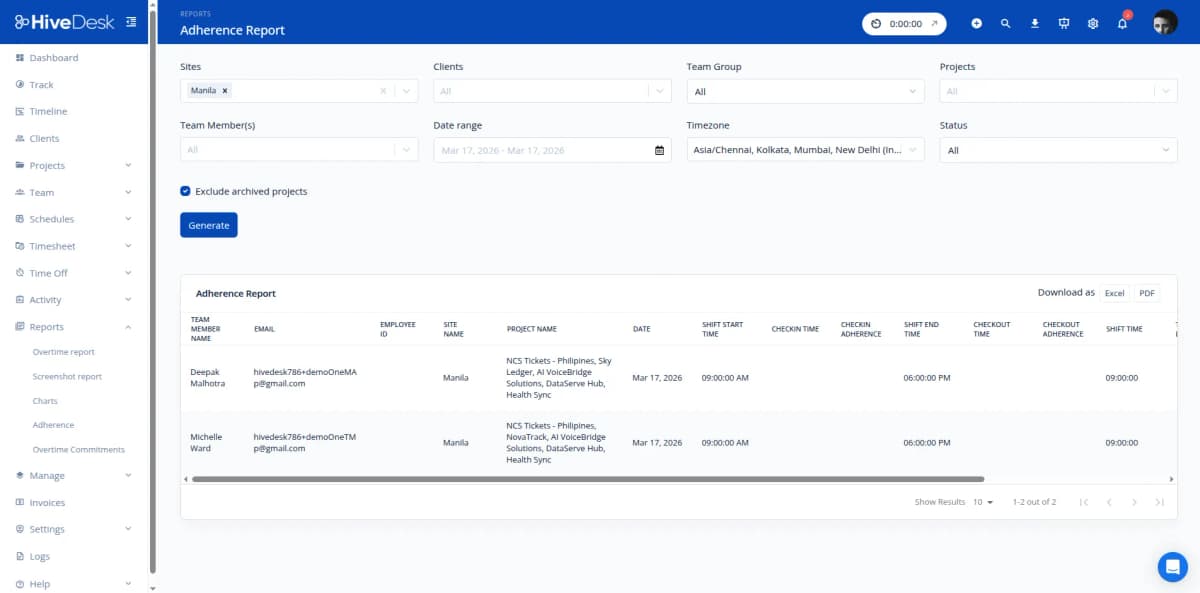
Adherence Reporting
Measure schedule adherence with actual clock-in/out data
HiveDesk compares every agent's actual clock-in and clock-out times against their scheduled shifts. The adherence report shows you exactly where gaps exist — by agent, team, shift, or date range. Export the data to calculate adherence percentages, identify chronic tardiness patterns, and quantify the impact of non-adherence on your staffing models.
- Automatic comparison of scheduled vs actual clock-in/out times
- Adherence data by agent, team, shift, or date range
- Identify chronic tardiness, early departures, and no-shows
- Export adherence data as Excel for further analysis
- Historical adherence trends to improve forecasting accuracy
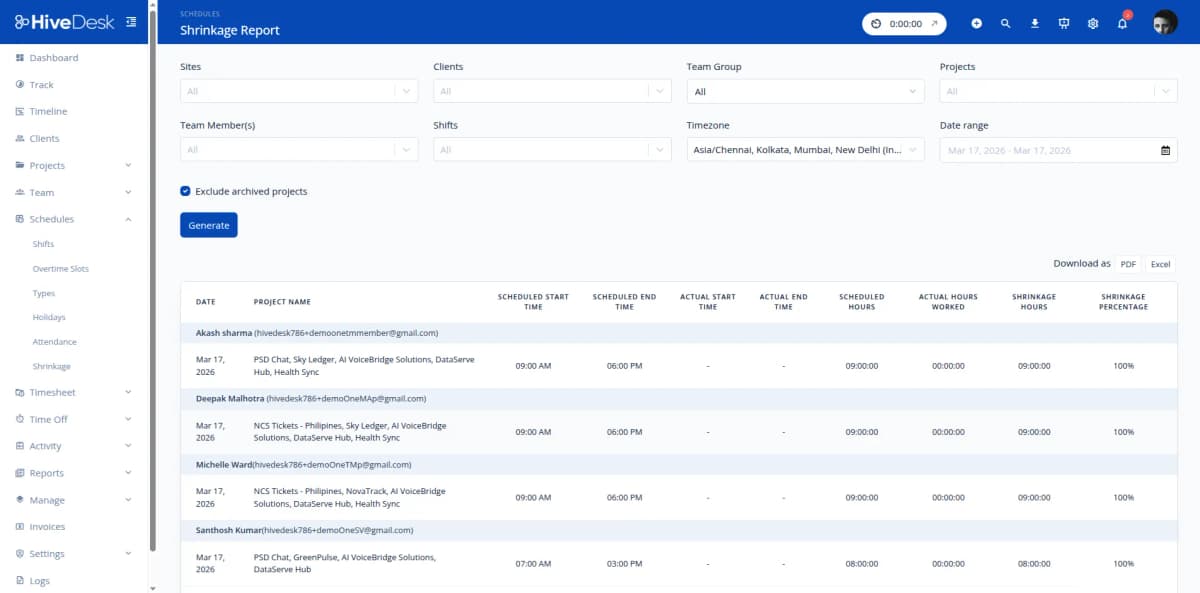
Shrinkage & Utilization
Measure actual shrinkage instead of estimating it
Most workforce models use estimated shrinkage rates. HiveDesk gives you the data to measure it. Compare scheduled hours against actual hours worked, and compare actual hours against productive time (based on activity levels). The shrinkage report breaks this down by agent, team, and time period — so your forecasts use real numbers, not assumptions.
- Scheduled hours vs actual hours worked — measured, not estimated
- Activity levels distinguish productive time from idle time
- Shrinkage data by agent, team, shift, and date range
- Calculate utilization rates from actual time data
- Feed accurate shrinkage percentages into your workforce models
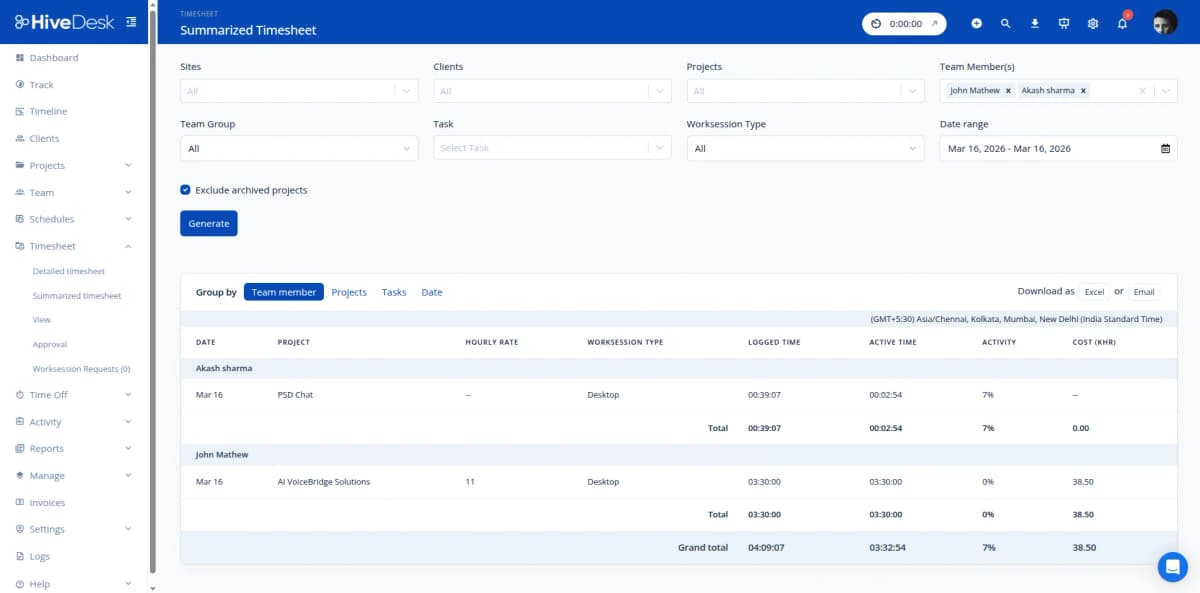
Historical Data & Export
Clean, exportable data for your forecasting models
Every tracked hour, clock-in, clock-out, and task switch is stored in HiveDesk. Pull reports for any date range — last week, last month, last quarter. Filter by team, shift, agent, or project. Export as Excel and import directly into your spreadsheets, BI tools, or Erlang calculators. No manual data cleanup required.
- Historical data accumulates automatically from day one
- Reports for any date range — days, weeks, months, quarters
- Filter by team, shift, agent, or project
- Export as Excel — clean data ready for your forecasting tools
- Attendance, overtime, adherence, and hours data in one system
All the Data You Need. $5/User/Month.
One plan with every feature included. No tiers, no hidden fees, no per-feature upsells.
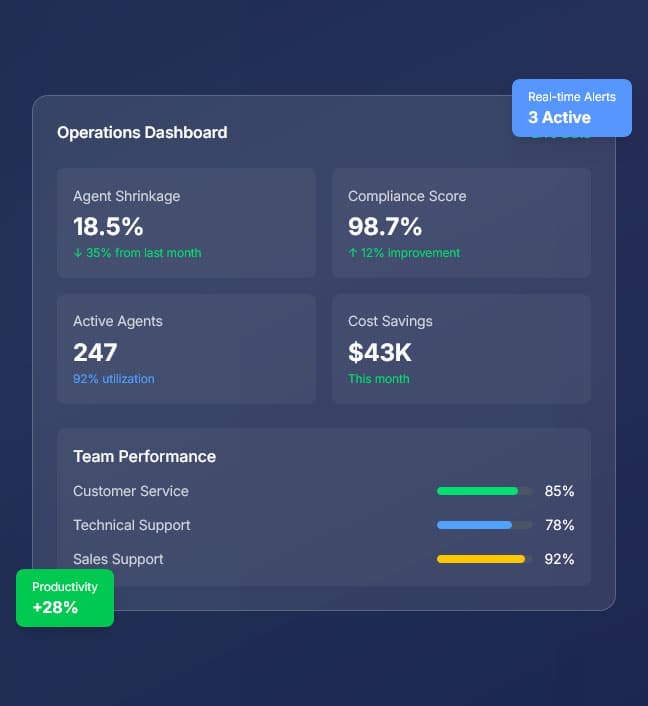
Real-Time Dashboards
Live view of agent activity, hours logged, and team status. Monitor current operations and identify staffing issues as they happen.
Automatic Time Tracking
Every agent hour tracked automatically by project, task, and shift. The raw data foundation for all your workforce analysis.
Shift Scheduling
Create shifts, assign agents, set up recurring schedules. Adherence reporting compares scheduled vs actual for analysis.
Attendance & Leave
Automated attendance from clock-in data. Leave management with balance tracking. All data available for workforce modeling.
Activity Monitoring
Activity levels and screenshots during work sessions. Measure productive time vs idle time for shrinkage calculations.
Reports & Export
Timesheets, adherence, attendance, overtime, activity, and shrinkage reports. Filter and export as Excel or PDF for analysis.
Trusted by Teams Across 6 Continents Since 2011
We have used every time tracking software under the sun, and they all fall short in some area that we need, but overall HiveDesk has met our needs. Their PDF screenshot reports are clean, easy to use and understand. Our clients prefer them over the complicated reports of other systems.
Frequently Asked Questions
Common questions about HiveDesk for contact center workforce analysts.
HiveDesk records every clock-in, clock-out, task switch, and work session for every agent. You get historical data on hours worked by agent, team, project, and date range. Activity levels, attendance records, overtime hours, and leave taken are all available in exportable reports. This data accumulates over time, giving you the historical foundation for forecasting and planning.
HiveDesk compares actual clock-in and clock-out times against scheduled shifts. The adherence report shows you — by agent, team, or date range — who arrived on time, who was late, who left early, and who missed shifts entirely. Export this data to calculate adherence percentages and identify patterns that affect your staffing models.
Yes. Pull historical hours data by team, shift, or project to understand actual staffing patterns. See how many productive hours your team delivers per shift, per week, or per month. Compare against scheduled hours to measure utilization. This data helps you build more accurate capacity models and staffing forecasts.
HiveDesk tracks total hours per agent per day and per week. Overtime is flagged automatically when agents exceed standard hours. You can pull overtime reports by agent, team, or date range to analyze overtime patterns — identifying which teams, shifts, or periods consistently require overtime and whether it correlates with specific staffing gaps.
Yes. All HiveDesk reports export as Excel or PDF. Export timesheets, attendance reports, adherence reports, overtime data, and activity reports. Import the Excel data into your existing spreadsheets, BI tools, or workforce management models for further analysis.
HiveDesk tracks scheduled hours, actual hours worked, and productive time (based on activity levels). By comparing these data points, you can calculate shrinkage — the gap between scheduled and productive hours. The shrinkage report shows this breakdown by agent, team, or date range, helping you quantify one of the biggest cost factors in contact center operations.
Yes. The attendance report shows clock-in/out data against scheduled shifts for any date range. Over weeks and months, you can identify agents with chronic tardiness, shifts with higher absenteeism, and seasonal patterns that affect staffing. Export the data for trend analysis in your own tools.
HiveDesk costs $5 per user per month — one plan with every feature included. No tiers, no per-feature upsells, no hidden fees. You get time tracking, activity monitoring, scheduling, attendance, leave management, timesheets, and all reporting. There is a 14-day free trial with no credit card required.
Related Resources
Role-Specific Solutions
Contact Center Solutions
Ready to Get Started?
Join teams worldwide who trust HiveDesk for workforce management, time tracking, and employee monitoring. $5/user/month, all features included.